Market Outlook
October 11, 2017
Market Cues
Domestic Indices
Chg (%)
(Pts)
(Close)
Indian markets are likely to open positive tracking global indices and SGX Nifty.
BSE Sensex
0.2
78
31,924
Nifty
0.3
28
10,017
U.S. stocks continued to remain directionless ahead of the Federal Reserve monetary
policy meeting on Wednesday. Investors stayed on the sidelines as earnings from
Mid Cap
0.6
102
15,936
major financial institutions and major economic data are expected in the next few
Small Cap
1.0
159
16,893
days.
Bankex
0.3
94
27,388
UK stocks posted a gain for the session as the pound rallied strongly. UK PM
Global Indices
Chg (%)
(Pts)
(Close)
Theresa May said that if talks with the EU fail then they would prepare for a ‘no-
deal’ Brexit. British industrial production grew 0.2 percent MoM in August. This is the
Dow Jones
0.3
170
22,831
fifth successive monthly rise for industrial production.
Nasdaq
0.1
58
6,587
FTSE
0.4
30
7,538
Indian Markets closed in positive territory as expectations regarding second quarter
Nikkei
(00.6
133
20,824
results helped market sentiment. The IT index posted gains for the session and
closed up 0.7 percent. The FMCG index closed slightly down by 0.2 percent on news
Hang Seng
0.6
164
28,491
that GST rollout might depress Q2 earnings for the sector.
Shanghai Com
0.3
9
3,383
News Analysis
Advances / Declines
BSE
NSE
Piramal Enterprises to invest `360cr to upgrade API plants
Advances
1,580
1,025
Detailed analysis is on Pg2
Declines
1,174
703
Unchanged
114
75
Investor’s Ready Reckoner
Key Domestic & Global Indicator
Volumes (` Cr)
Stock Watch: Latest investment recommendations on 150+ stocks
BSE
3,898
Refer Pg7 onwards
NSE
26,367
Top Picks
CMP
Target
Upside
Company
Sector
Rating
#Net Inflows (` Cr)
Net
Mtd
Ytd
(`)
(`)
(%)
Blue Star
Capital Goods Accumulate
812
867
6.8
FII
(5(439)
(2(3,021)
4133,50
Dewan Housing FinanceFinancials
Accumulate
552
610
10.6
MFs
1,156
4,3,611
1489,95
Asian Granito
Other
Buy
496
570
15.0
Navkar Corporation
Other
Buy
187
265
41.7
Top Gainer
Price (`)
Chg (%)
KEI Industries
Capital Goods
Accumulate
352
380
7.9
More Top Picks on Pg5
Jmfinancil
178
14.9
Adanitrans
193
10.0
Key Upcoming Events
Previous
Consensus
Religare
55
9.9
Date
Region
Event Description
Reading
Expectations
Strtech
243
9.6
Oct12, 2017 US
Initial Jobless claims
260.00
250.00
Ghcl
236
7.9
Oct12, 2017 India
Industrial Production YoY
1.20
Oct12, 2017 US
Producer Price Index (mom)
0.50
Oct13, 2017 India
Imports YoY%
21.00
Top Loser
Price (`)
Chg (%)
Oct13, 2017 China
Exports YoY%
5.60
10.00
Southbank
230
(6.2)
More Events on Pg7
Sobha
437
(4.9)
Pcjeweller
364
(4.1)
Welspunind
68
(3.3)
Aegislog
229
(2.8)
#as on 10th Oct, 2017
Market Outlook
October 11, 2017
News Analysis
Piramal Enterprises to invest `360cr to upgrade API plants
Piramal Enterprises has invested around
`360 crore to upgrade its active
pharmaceutical ingredient (API) manufacturing plants in India and the US. The
company plans to use this investment to boost to its contract manufacturing
business.
Healthcare is the largest segment of the company and contributed around 47
percent of the company's FY
17 revenue. Within healthcare, contract
manufacturing is the largest division accounts for 60 percent of the segment
revenue. The company has five manufacturing sites in India, the US and Europe.
Over the last two years, the company had acquired two contract-manufacturing
companies in the US that were engaged in development of sterile injectables and
high potency anti-cancer agents to grow its business.
Economic and Political News
Gujarat elections to be held in December: Election Commission
Non-life insurers premium collection at `17,530cr in September 2017, up
14% YoY: Irdai
Insolvency and Bankruptcy Board of India publishes draft rules on insolvency
resolution process for individual businesses
Corporate News
Allahabad Bank plans capital raise of up to `2,000cr
Coal India workers to get 20% wage hike, new pension fund norms and
medical trust
VA Tech Wabag files appeal against National Company Law Tribunal order
M&M to sell petrol and electric cars; will launch electric version of KUV1OO in
2018
Market Outlook
October 11, 2017
Top Picks
Market Cap
CMP
Target
Upside
Company
Rationale
(` Cr)
(`)
(`)
(%)
Strong growth in domestic business due to its leade`hip
in acute therapeutic segment. Alkem expects to launch
Alkem Laboratories
22,105
1,849
2,079
12.5
more products in USA, which bodes for its international
business.
We expect the company would report strong profitability
Asian Granito
1,492
496
570
15.0
owing to better product mix, higher B2C sales and
amalgamation synergy.
Favorable outlook for the AC industry to augur well for
Cooling products business which is out pacing the
Blue Star
7,771
812
867
6.8
market growth. EMPPAC division's profitability to
improve once operating environment turns around.
With a focus on the low and medium income (LMI)
consumer segment, the company has increased its
Dewan Housing Finance
17,294
552
610
10.6
presence in tier-II & III cities where the growth
opportunity is immense.
Loan growth is likely to pick up after a sluggish FY17.
Lower credit cost will help in strong bottom-line growth.
Karur Vysya Bank
8,835
146
180
23.1
Increasing share of CASA will help in NIM
improvement.
High order book execution in EPC segment, rising B2C
KEI Industries
2,739
352
380
7.9
sales and higher exports to boost the revenues and
profitability
Expected to benefit from the lower capex requirement
Music Broadcast
2,309
405
434
7.2
and 15 year long radio broadcast licensing.
Massive capacity expansion along with rail advantage
Navkar Corporation
2,667
187
265
41.7
at ICD as well CFS augur well for the company
Strong brands and distribution network would boost
Siyaram Silk Mills
2,489
2,655
2,856
7.6
growth going ahead. Stock currently trades at an
inexpensive valuation.
Market leaderhip in Hindi news genre and no.
2
viewe`hip ranking in English news genre, exit from the
TV Today Network
2,323
389
435
11.7
radio business, and anticipated growth in ad spends by
corporates to benefit the stock.
After GST, the company is expected to see higher
volumes along with improving product mix. The Gujarat
Maruti Suzuki
2,38,575
7,898
8,658
9.6
plant will also enable higher operating leverage which
will be margin accretive.
We expect loan book to grow at 24.3% over next two
GIC Housing
2,768
514
655
27.4
year; change in borrowing mix will help in NIM
improvement..
Source: Company, Angel Research
Market Outlook
October 11, 2017
Key Upcoming Events
Global economic events release calendar
Bloomberg Data
Date
Time
Country
Event Description
Unit
Period
Last Reported
Estimated
Oct 12, 2017
6:00 PMUS
Initial Jobless claims
Thousands
Oct 7
260.00
250.00
5:30 PMIndia
Industrial Production YoY
% Change
Aug
1.20
US
Producer Price Index (mom)
% Change
Sep
0.50
Oct 13, 2017
India
Imports YoY%
% Change
Sep
21.00
China
Exports YoY%
% Change
Sep
5.60
10.00
India
Exports YoY%
% Change
Sep
10.30
6:00 PMUS
Consumer price index (mom)
% Change
Sep
0.40
0.60
Oct 16, 2017
12:00 PMIndia
Monthly Wholesale Prices YoY%
% Change
Sep
3.24
7:00 AMChina
Consumer Price Index (YoY)
% Change
Sep
1.80
1.60
Oct 17, 2017
2:30 PMEuro Zone
Euro-Zone CPI (YoY)
%
Sep F
1.50
6:45 PMUS
Industrial Production
%
Sep
(0.90)
-
2:00 PMUK
CPI (YoY)
% Change
Sep
2.90
Oct 18, 2017
6:00 PMUS
Housing Starts
Thousands
Sep
1,180.00
1,170.00
6:00 PMUS
Building permits
Thousands
Sep
1,272.00
1,230.00
2:00 PMUK
Jobless claims change
% Change
Sep
(2.80)
Oct 19, 2017
7:30 AMChina
Industrial Production (YoY)
% Change
Sep
6.00
6.40
7:30 PMUS
Existing home sales
Million
Sep
5.35
5.30
Oct 20, 2017
7:30 AMChina
Real GDP (YoY)
% Change
3Q
6.90
6.80
Oct 23, 2017
7:30 PMEuro Zone
Euro-Zone Consumer Confidence
Value
Oct A
(1.20)
Oct 24, 2017
1:00 PMGermany
PMI Manufacturing
Value
Oct P
60.60
1:00 PMGermany
PMI Services
Value
Oct P
55.60
Oct 25, 2017
2:00 PMUK
GDP (YoY)
% Change
3Q A
1.50
7:30 PMUS
New home sales
Thousands
Sep
560.00
550.00
Oct 26, 2017
5:15 PMEuro Zone
ECB announces interest rates
%
Oct 26
-
Source: Bloomberg, Angel Research
Market Outlook
October 11, 2017
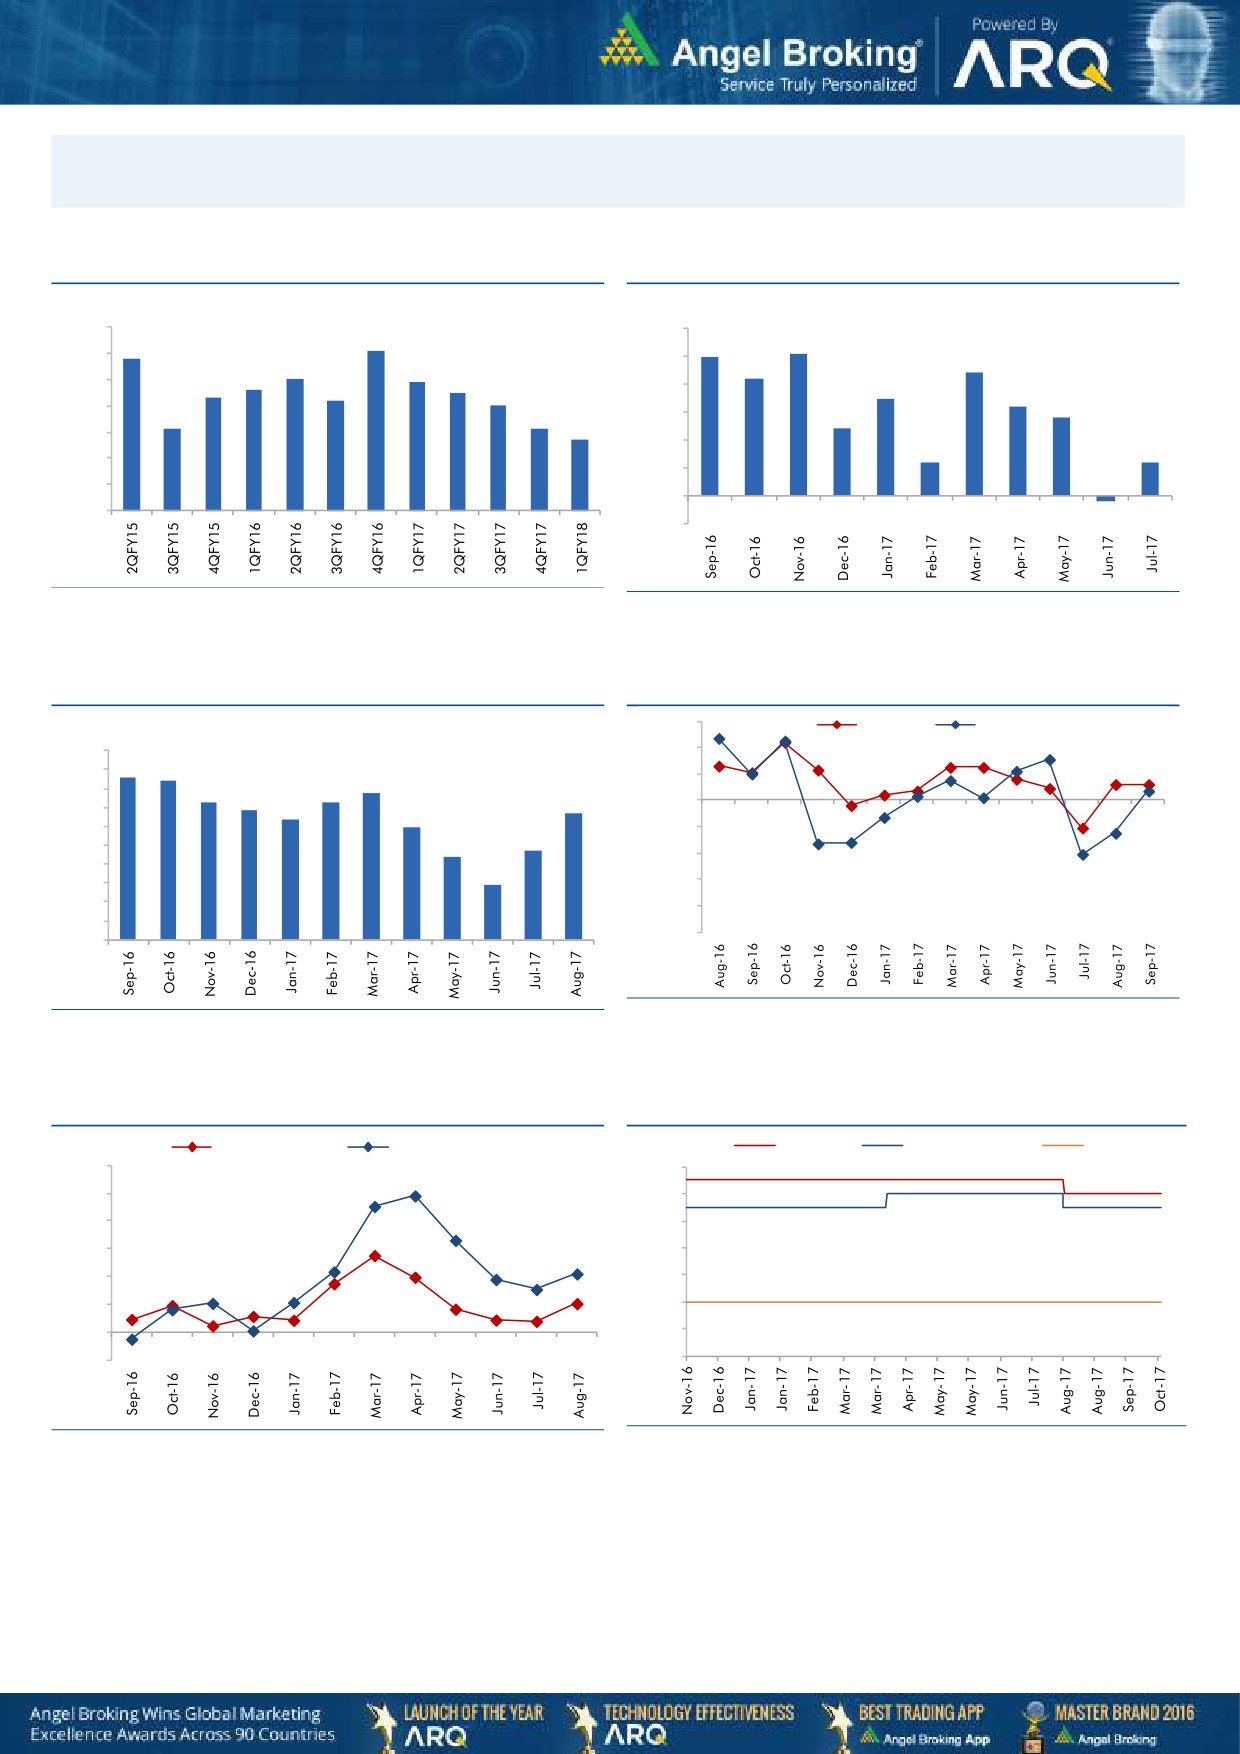
Macro watch
Exhibit 1: Quarterly GDP trends
Exhibit 2: IIP trends
(%)
(%)
10.0
6.0
9.1
5.1
8.8
5.0
9.0
5.0
4.4
8.0
7.9
4.2
7.6
7.5
8.0
7.3
7.2
4.0
3.5
7.0
3.2
2.8
7.0
6.1
6.1
3.0
2.4
5.7
6.0
2.0
1.2
1.2
5.0
1.0
4.0
-
3.0
(1.0)
(0.2)
Source: CSO, Angel Research
Source: MOSPI, Angel Research
Exhibit 3: Monthly CPI inflation trends
Exhibit 4: Manufacturing and services PMI
56.0
Mfg. PMI
Services PMI
(%)
5.0
54.0
4.3
4.2
4.5
3.9
52.0
4.0
3.6
3.7
3.4
3.4
3.2
50.0
3.5
3.0
3.0
48.0
2.4
2.2
2.5
46.0
2.0
1.5
1.5
44.0
1.0
42.0
0.5
40.0
-
Source: Market, Angel Research; Note: Level above 50 indicates expansion
Source: MOSPI, Angel Research
Exhibit 5: Exports and imports growth trends
Exhibit 6: Key policy rates
(%)
Exports yoy growth
Imports yoy growth
(%)
Repo rate
Reverse Repo rate
CRR
60.0
6.50
50.0
6.00
40.0
5.50
30.0
5.00
20.0
4.50
10.0
4.00
0.0
3.50
(10.0)
3.00
Source: Bloomberg, Angel Research
Source: RBI, Angel Research
Market Outlook
October 11, 2017
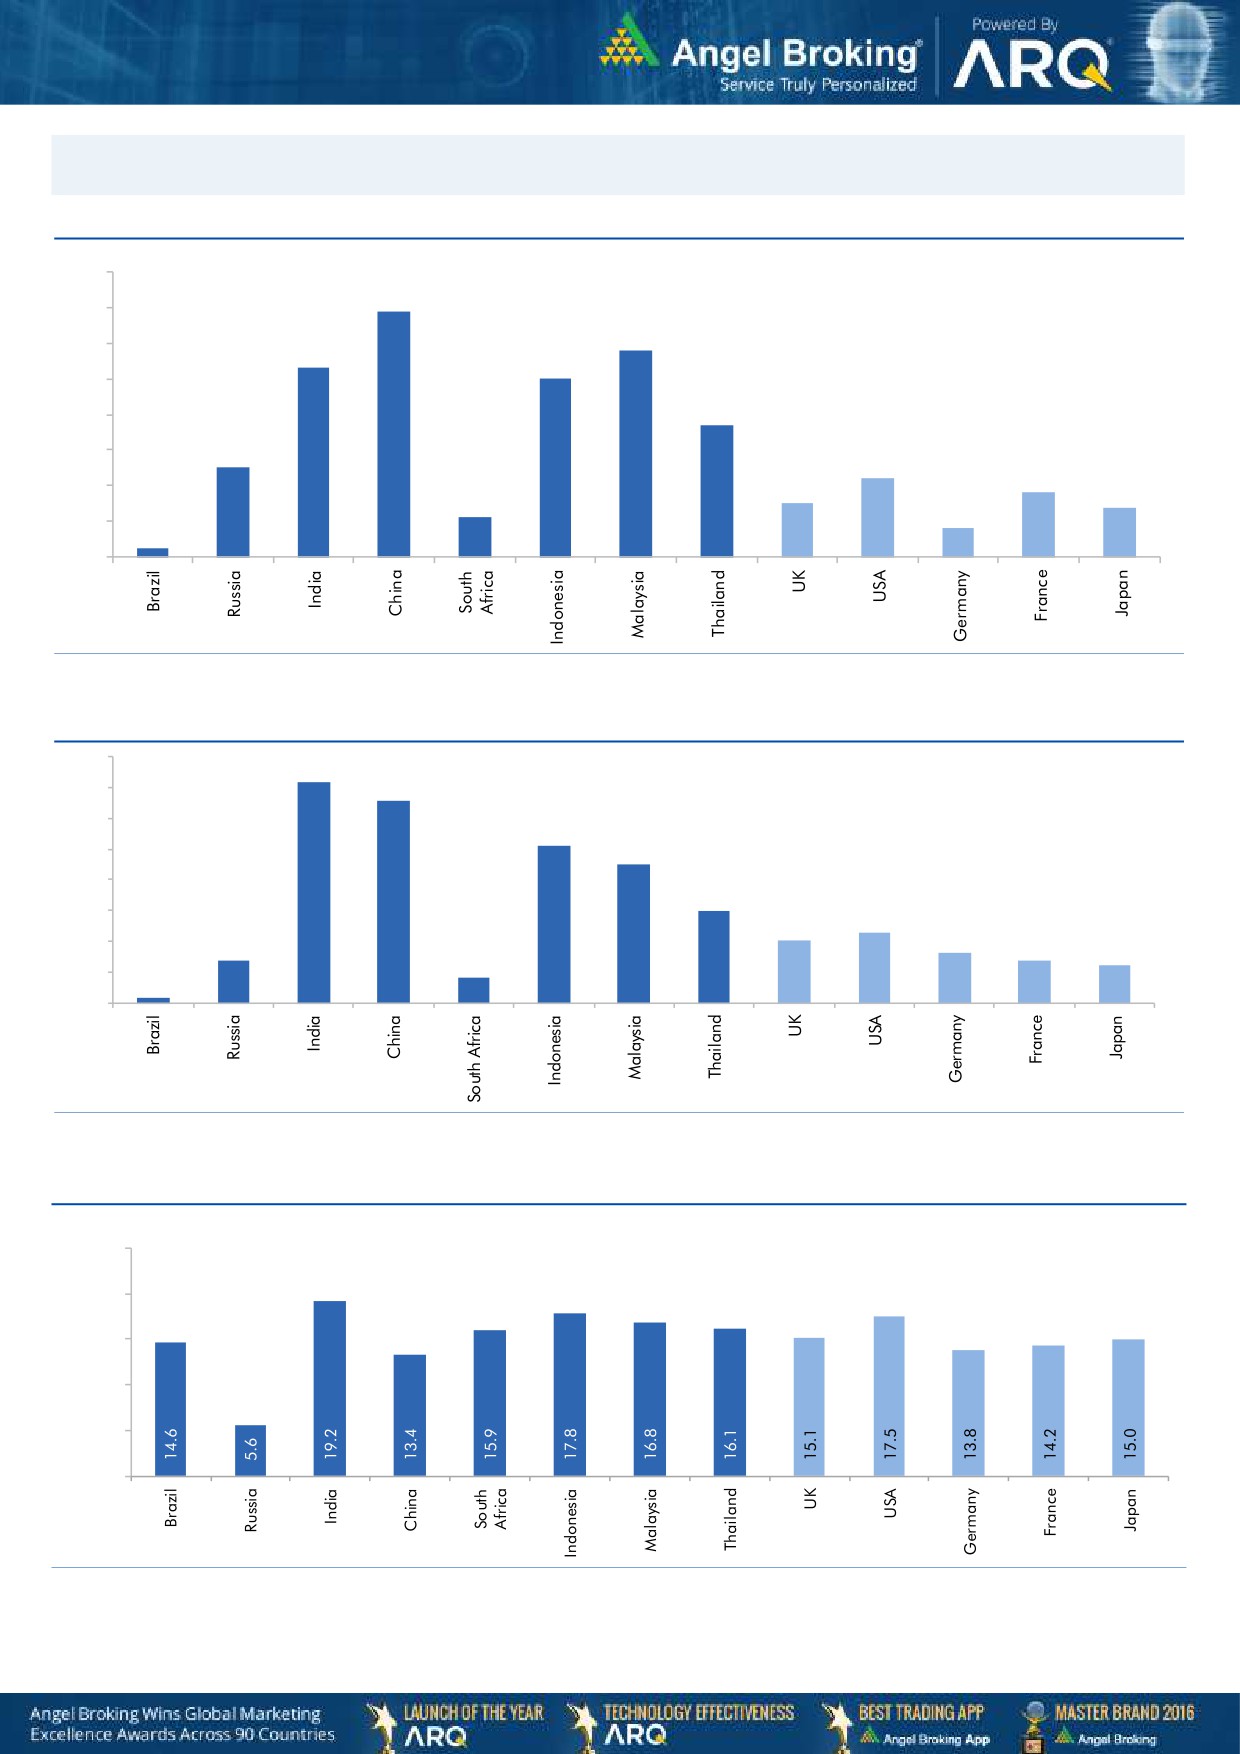
Global watch
Exhibit 1: Latest quarterly GDP Growth (%, yoy) across select developing and developed countries
(%)
8.0
6.9
7.0
5.8
6.0
5.3
5.0
5.0
1.1
3.7
4.0
2.5
3.0
2.2
1.8
2.0
1.5
1.4
0.8
1.0
0.3
-
Source: Bloomberg, Angel Research
Exhibit 2: 2017 GDP Growth projection by IMF (%, yoy) across select developing and developed countries
(%)
7.2
6.6
7.0
6.0
5.1
5.0
4.5
4.0
3.0
3.0
2.3
2.0
1.4
1.6
2.0
1.4
1.2
0.2
0.8
1.0
-
Source: IMF, Angel Research
Exhibit 3: One year forward P-E ratio across select developing and developed countries
(x)
25.0
20.0
15.0
10.0
5.0
-
Source: IMF, Angel Research, data as of 10th Oct-17
Market Outlook
October 11, 2017
Exhibit 4: Relative performance of indices across globe
Returns (%)
Country
Name of index
Closing price
1M
3M
1YR
Brazil
Bovespa
76,897
5.2
20.5
26.8
Russia
Micex
2,087
2.7
6.8
4.7
India
Nifty
10,017
0.9
3.6
14.6
China
Shanghai Composite
3,383
0.2
5.4
13.6
South Africa
Top 40
51,363
3.9
11.7
14.0
Mexico
Mexbol
49,983
(0.2)
(1.6)
4.3
Indonesia
LQ45
983
0.3
1.3
5.9
Malaysia
KLCI
1,761
(1.2)
(0.5)
6.6
Thailand
SET 50
1,092
4.4
10.0
13.3
USA
Dow Jones
22,831
4.7
6.6
25.9
UK
FTSE
7,538
2.2
2.8
7.3
Japan
Nikkei
20,824
7.6
4.1
25.5
Germany
DAX
12,949
5.3
4.1
22.4
France
CAC
5,364
4.9
2.7
19.0
Source: Bloomberg, Angel Research, data as of 10th Oct-17 p68in4
Stock Watch
October 11, 2017
Company Name
Reco
CMP
Target
Mkt Cap
Sales ( Čcr )
OPM(%)
EPS (Č)
PER(x)
P/BV(x)
RoE(%)
EV/Sales(x)
(Č)
Price ( Č)
( Č cr )
FY18E FY19E
FY18E
FY19E
FY18E
FY19E
FY18E
FY19E
FY18E
FY19E
FY18E
FY19E
FY18E
FY19E
Agri / Agri Chemical
Rallis
Reduce
237
209
4,610
1,873
2,099
15.0
15.0
9.5
10.5
25.0
22.6
3.8
3.4
15.8
16.0
2.4
2.1
United Phosphorus
Neutral
820
-
41,636
18,922
21,949
18.0
18.5
36.2
45.6
22.6
18.0
4.7
3.9
22.7
23.8
2.4
2.0
Auto & Auto Ancillary
Ashok Leyland
Neutral
126
-
36,977
23,339
27,240
10.1
10.8
4.7
6.2
27.2
20.3
5.4
4.8
20.0
23.6
1.5
1.3
Bajaj Auto
Neutral
3,135
-
90,714
23,936
27,955
19.5
20.1
142.7
167.3
22.0
18.7
4.8
4.3
21.8
22.8
3.4
2.8
Bharat Forge
Buy
653
875
30,394
7,637
8,755
21.7
23.2
36.1
47.3
18.1
13.8
3.2
2.8
18.5
20.8
3.8
3.3
Eicher Motors
Neutral
31,545
-
85,874
19,043
22,837
19.5
19.9
835.4
1,019.0
37.8
31.0
14.1
10.9
40.9
37.8
4.4
3.6
Gabriel India
Neutral
199
-
2,853
1,782
2,033
9.7
10.2
7.1
8.9
28.0
22.4
5.7
4.8
21.0
22.2
1.6
1.3
Hero Motocorp
Accumulate
3,692
4,129
73,736
32,239
36,878
16.0
15.6
184.4
206.5
20.0
17.9
6.3
5.5
31.3
30.7
2.1
1.8
Jamna Auto Industries Neutral
59
-
2,369
1,441
1,662
14.4
14.8
13.9
17.6
4.3
3.4
1.2
1.0
30.0
31.0
1.6
1.4
Mahindra and Mahindra Neutral
1,303
-
80,916
46,971
53,816
13.6
14.0
67.7
79.8
19.2
16.3
2.8
2.5
15.0
15.9
1.6
1.4
Maruti
Accumulate
7,898
8,658
238,575
81,825
101,245
15.0
15.0
283.5
356.0
27.9
22.2
6.1
5.0
21.9
22.4
2.6
2.0
Minda Industries
Neutral
818
-
7,072
4,328
5,084
11.0
11.9
27.3
36.4
30.0
22.5
6.4
5.0
23.1
25.6
1.7
1.5
Motherson Sumi
Neutral
347
-
72,955
55,937
64,445
10.8
11.4
16.9
21.1
20.5
16.5
4.6
4.7
25.2
25.4
1.4
1.1
Tata Motors
Neutral
424
-
122,366
303,167
343,649
11.8
13.8
33.1
54.7
12.8
7.8
2.1
1.7
16.9
23.0
0.5
0.4
TVS Motor
Neutral
686
-
32,581
13,992
16,216
9.0
9.4
17.1
20.3
40.2
33.8
10.7
8.3
29.7
27.7
2.3
1.9
Amara Raja Batteries
Buy
690
858
11,788
6,140
7,122
14.3
15.6
29.3
39.0
23.6
17.7
4.0
3.4
17.1
19.0
1.9
1.6
Exide Industries
Neutral
208
-
17,676
8,689
9,854
15.1
15.2
9.7
11.0
21.6
18.9
3.8
3.4
15.7
16.1
1.8
1.5
Apollo Tyres
Neutral
242
-
12,329
15,739
17,326
13.3
14.6
20.4
26.7
11.9
9.1
1.4
1.3
20.4
26.7
1.0
0.9
Ceat
Neutral
1,755
-
7,100
6,661
7,717
11.1
14.2
116.2
178.2
15.1
9.9
2.6
2.2
15.2
21.3
1.2
1.0
JK Tyres
Neutral
152
-
3,456
8,318
9,239
16.2
16.4
21.0
27.5
7.3
5.5
1.4
1.2
19.1
20.4
0.9
0.7
Swaraj Engines
Neutral
2,150
-
2,671
788
889
16.4
16.5
71.6
81.0
30.0
26.6
8.7
8.0
29.6
31.0
3.0
2.6
Subros
Neutral
252
-
1,514
1,855
2,135
11.6
11.8
10.3
14.7
24.6
17.2
3.7
3.2
15.8
19.1
1.0
0.9
Capital Goods
BEML
Neutral
1,730
-
7,204
4,286
5,194
7.1
8.2
42.9
58.1
40.3
29.8
3.3
3.0
7.6
8.7
1.7
1.4
Bharat Electronics
Neutral
165
-
40,602
10,258
12,470
19.6
19.5
7.3
8.6
22.6
19.2
0.4
0.4
20.4
21.9
3.5
2.8
Voltas
Neutral
528
-
17,484
6,778
8,004
9.6
11.0
17.1
22.4
30.9
23.6
7.4
6.5
17.7
19.8
2.3
1.9
BHEL
Neutral
87
-
31,813
33,200
39,167
6.8
9.5
6.2
11.2
14.0
7.7
0.6
0.6
4.6
8.0
0.5
0.4
Blue Star
Accumulate
812
867
7,771
5,220
6,207
6.3
6.6
16.8
22.3
48.3
36.4
9.6
8.5
19.9
23.3
1.5
1.2
CG Power and Industrial
Neutral
80
-
4,986
6,555
7,292
7.5
7.5
-
0.8
7,955.0
99.4
1.2
1.2
0.1
1.2
0.9
0.8
Solutions
Greaves Cotton
Neutral
135
-
3,296
1,778
1,993
14.7
15.1
8.1
9.1
16.7
14.8
3.7
3.5
21.8
23.6
1.6
1.4
Stock Watch
October 11, 2017
Company Name
Reco
CMP
Target
Mkt Cap
Sales ( Čcr )
OPM(%)
EPS (Č)
PER(x)
P/BV(x)
RoE(%)
EV/Sales(x)
(Č)
Price ( Č)
( Č cr )
FY18E FY19E
FY18E
FY19E
FY18E
FY19E
FY18E
FY19E
FY18E
FY19E
FY18E
FY19E
FY18E
FY19E
Capital Goods
KEC International
Buy
304
350
7,823
9,779
11,113
9.4
9.8
14.2
18.2
21.4
16.7
4.1
3.4
21.1
22.1
1.1
0.9
KEI Industries
Accumulate
352
380
2,739
3,001
3,391
10.0
10.0
13.0
16.1
27.1
21.9
4.9
4.1
18.2
18.7
1.1
1.0
Thermax
Neutral
916
-
10,915
4,125
4,747
10.3
10.8
26.7
31.5
34.3
29.1
3.8
3.5
11.2
12.0
2.4
2.1
VATech Wabag
Buy
578
681
3,156
3,867
4,126
9.6
10.0
34.9
39.8
16.6
14.5
2.7
2.4
17.7
17.5
0.8
0.8
Cement
ACC
Neutral
1,733
-
32,537
12,255
13,350
13.5
14.3
58.0
66.2
29.9
26.2
3.5
3.3
11.5
12.2
2.6
2.4
Ambuja Cements
Neutral
278
-
55,201
10,250
11,450
17.5
19.0
7.2
8.3
38.6
33.5
2.8
2.6
7.0
7.8
5.2
4.6
India Cements
Neutral
184
-
5,659
6,135
6,750
14.8
15.2
8.5
11.5
21.6
16.0
1.1
1.0
4.8
6.2
1.3
1.1
JK Cement
Neutral
975
-
6,819
4,150
4,775
19.2
20.0
49.0
63.5
19.9
15.4
3.2
2.7
17.0
18.5
2.1
1.8
J K Lakshmi Cement
Neutral
388
-
4,570
3,422
3,757
15.5
17.0
13.5
23.2
28.8
16.7
3.0
2.6
10.8
15.5
1.7
1.5
Orient Cement
Neutral
155
-
3,174
2,215
3,233
16.8
17.0
5.9
6.9
26.3
22.5
2.0
1.9
10.8
10.1
2.4
1.6
UltraTech Cement
Neutral
3,963
-
108,802
28,250
35,150
20.2
23.5
77.5
122.2
51.1
32.4
4.3
3.9
9.6
14.8
4.3
3.5
Construction
KNR Constructions
Neutral
209
-
2,936
1,846
2,203
14.5
14.5
12.1
13.7
17.3
15.3
0.9
0.8
17.5
16.7
1.6
1.4
Larsen & Toubro
Neutral
1,143
-
160,054
95,787
109,476
10.2
11.6
44.5
50.8
25.7
22.5
3.2
3.0
12.9
13.1
2.2
2.0
Gujarat Pipavav Port
Neutral
144
-
6,945
739
842
61.6
62.7
5.1
6.2
28.2
23.4
3.5
3.4
12.7
14.9
8.9
7.7
PNC Infratech
Neutral
148
-
3,787
2,040
2,935
13.0
13.0
6.4
9.0
23.1
16.4
0.6
0.5
9.7
12.2
1.9
1.3
Simplex Infra
Neutral
494
-
2,446
6,012
6,619
11.6
11.7
21.1
31.0
23.5
16.0
1.6
1.5
6.5
8.6
0.9
0.8
Sadbhav Engineering
Accumulate
280
298
4,801
3,823
4,426
10.7
10.8
10.3
11.8
27.2
23.7
3.3
2.9
10.1
10.5
1.6
1.4
NBCC
Neutral
220
-
19,805
9,099
12,706
6.4
6.4
7.3
9.6
30.2
23.0
1.3
1.1
27.5
30.5
2.0
1.5
MEP Infra
Neutral
100
-
1,618
2,403
2,910
18.3
16.8
2.4
6.1
42.3
16.4
16.1
10.8
35.2
55.8
1.8
1.5
SIPL
Neutral
100
-
3,510
2,060
2,390
46.8
47.7
(5.8)
(3.1)
3.7
4.3
(14.2)
(2.3)
6.5
6.0
Engineers India
Neutral
150
-
10,105
1,795
2,611
21.1
22.4
5.9
8.1
25.4
18.5
1.8
1.8
12.9
16.1
4.0
2.6
Financials
Axis Bank
Accumulate
514
580
123,224
32,558
35,843
3.5
3.2
27.8
41.0
18.5
12.5
2.0
1.8
11.4
14.9
-
-
Bank of Baroda
Neutral
142
-
32,627
22,533
26,079
2.4
2.4
12.0
20.9
11.8
6.8
0.8
0.7
6.6
11.0
-
-
Canara Bank
Neutral
315
-
18,797
17,925
20,235
2.0
2.1
18.5
36.5
17.0
8.6
0.6
0.6
3.4
6.2
-
-
Can Fin Homes
Neutral
2,624
-
6,986
586
741
3.5
3.5
107.8
141.0
24.3
18.6
5.3
4.3
24.1
25.6
-
-
Cholamandalam Inv. &
Accumulate
1,121
1,230
17,519
2,826
3,307
6.3
6.3
53.7
64.6
20.9
17.4
3.6
3.0
18.3
18.9
-
-
Fin. Co.
Dewan Housing Finance Accumulate
552
610
17,294
2,676
3,383
2.4
2.7
37.4
49.7
14.8
11.1
1.9
1.7
13.8
16.2
-
-
Equitas Holdings
Buy
154
235
5,228
1,125
1,380
9.6
9.8
1.5
6.0
102.9
25.7
2.3
2.2
2.4
8.2
-
-
Federal Bank
Accumulate
118
125
22,996
4,896
5,930
2.8
3.1
5.4
7.6
22.0
15.6
1.9
1.7
8.5
11.0
-
-
Stock Watch
October 11, 2017
Company Name
Reco
CMP
Target
Mkt Cap
Sales ( Čcr )
OPM(%)
EPS (Č)
PER(x)
P/BV(x)
RoE(%)
EV/Sales(x)
(Č)
Price ( Č)
( Č cr )
FY18E FY19E
FY18E
FY19E
FY18E
FY19E
FY18E
FY19E
FY18E
FY19E
FY18E
FY19E
FY18E
FY19E
Financials
GIC Housing
Buy
514
655
2,768
376
477
3.6
3.7
33.0
40.0
15.6
12.9
2.8
2.4
20.0
23.0
-
-
HDFC Bank
Neutral
1,803
-
465,335
55,236
63,253
4.5
4.4
68.9
82.4
26.2
21.9
4.6
3.8
18.7
18.5
-
-
ICICI Bank
Buy
269
315
172,755
42,361
51,378
3.6
3.9
18.4
25.7
14.7
10.5
1.6
1.5
11.3
15.0
-
-
Karur Vysya Bank
Buy
146
180
8,835
3,289
3,630
3.7
3.9
10.8
14.1
13.5
10.4
1.6
1.4
12.5
14.7
-
-
LIC Housing Finance
Neutral
662
-
33,416
4,895
6,332
3.4
3.7
50.7
66.8
13.1
9.9
2.6
2.2
21.7
23.8
-
-
Punjab Natl.Bank
Neutral
137
-
29,132
23,708
25,758
2.1
2.1
5.9
16.4
23.3
8.3
0.7
0.7
3.0
8.3
-
-
RBL Bank
Neutral
517
-
21,376
2,309
2,888
2.6
2.5
16.4
19.1
31.6
27.1
4.0
3.5
13.3
13.8
-
-
Repco Home Finance
Buy
659
825
4,120
496
597
4.4
4.2
38.5
48.7
17.1
13.5
3.1
2.5
19.6
20.6
-
-
South Ind.Bank
Neutral
30
-
5,422
3,195
3,567
3.0
3.1
3.0
3.8
10.0
7.8
1.0
0.9
10.5
11.9
-
-
St Bk of India
Neutral
257
-
221,542
105,827
121,056
2.4
2.5
16.1
25.6
16.0
10.0
1.3
1.1
6.6
9.9
-
-
Union Bank
Neutral
132
-
9,556
14,650
16,225
2.3
2.3
23.1
32.5
5.7
4.1
0.4
0.4
7.1
9.2
-
-
Yes Bank
Neutral
373
-
85,330
11,088
13,138
3.0
2.9
84.0
99.3
4.4
3.8
0.7
0.6
16.3
16.8
-
-
FMCG
Akzo Nobel India
Neutral
1,839
-
8,818
3,164
3,607
13.8
13.7
58.6
67.9
31.4
27.1
7.7
6.8
24.5
25.1
2.6
2.3
Asian Paints
Neutral
1,162
-
111,502
17,603
20,615
18.6
18.6
2,128.9
2,543.3
0.6
0.5
11.5
9.7
28.0
28.9
6.1
5.2
Britannia
Neutral
4,343
-
52,145
9,690
11,278
14.8
15.4
84.0
101.0
51.7
43.0
18.8
15.0
40.6
39.0
5.3
4.6
Colgate
Neutral
1,089
-
29,621
4,420
5,074
24.9
25.3
28.6
32.8
38.1
33.2
15.0
12.1
43.8
40.5
6.4
5.6
Dabur India
Neutral
316
-
55,735
8,346
9,344
19.6
19.9
7.8
9.0
40.6
35.2
8.2
7.4
25.2
24.8
6.3
5.5
GlaxoSmith Con*
Neutral
4,990
-
20,988
5,072
5,760
18.2
18.4
176.3
199.2
28.3
25.1
6.0
5.4
21.2
21.7
3.5
3.0
Godrej Consumer
Neutral
992
-
67,608
10,171
11,682
20.8
21.5
21.7
27.1
45.7
36.6
10.3
8.8
22.3
23.4
6.8
5.8
HUL
Neutral
1,208
-
261,501
37,077
41,508
20.3
21.8
5,189.9
6,318.5
0.2
0.2
36.8
31.5
74.8
82.0
6.9
6.2
ITC
Neutral
266
-
323,753
44,588
49,853
37.0
37.3
9.6
11.0
27.7
24.2
6.8
6.5
25.1
27.3
6.7
6.0
Marico
Neutral
317
-
40,882
6,788
7,766
18.5
19.2
7.1
8.5
44.6
37.3
15.6
13.4
36.9
38.0
5.9
5.1
Nestle*
Neutral
7,288
-
70,271
10,083
11,182
20.0
20.9
119.7
141.3
60.9
51.6
214.6
196.1
36.7
39.8
6.6
5.9
Tata Global
Neutral
208
-
13,153
7,121
7,641
11.9
12.3
6.9
8.0
30.2
26.1
2.0
1.9
6.8
7.2
1.7
1.5
Procter & Gamble
Neutral
8,651
-
28,082
3,034
3,579
27.1
27.7
167.7
198.8
51.6
43.5
13.9
11.9
28.8
29.5
8.7
7.3
Hygiene
IT
HCL Tech^
Accumulate
898
1,014
128,201
52,342
57,053
20.9
20.9
62.8
67.6
14.3
13.3
3.2
2.7
22.4
20.6
2.1
1.8
Infosys
Buy
936
1,179
214,904
73,963
80,619
26.0
26.0
64.4
69.3
14.5
13.5
2.9
2.6
19.7
19.6
2.3
2.1
TCS
Accumulate
2,460
2,651
484,637
127,403
138,870
27.6
27.6
144.5
156.0
17.0
15.8
5.1
4.7
29.7
29.8
3.5
3.1
Tech Mahindra
Accumulate
465
533
45,365
31,015
33,496
15.0
15.0
35.6
38.1
13.1
12.2
2.2
2.1
17.0
16.3
1.2
1.1
Stock Watch
October 11, 2017
Company Name
Reco
CMP
Target
Mkt Cap
Sales ( Čcr )
OPM(%)
EPS (Č)
PER(x)
P/BV(x)
RoE(%)
EV/Sales(x)
(Č)
Price ( Č)
( Č cr )
FY18E FY19E
FY18E
FY19E
FY18E
FY19E
FY18E
FY19E
FY18E
FY19E
FY18E
FY19E
FY18E
FY19E
IT
Wipro
Neutral
287
-
139,455
58,536
61,858
20.3
20.3
18.2
19.1
15.7
15.0
2.5
2.1
14.6
13.4
2.3
2.2
Media
D B Corp
Neutral
382
-
7,019
2,404
2,625
30.5
31.5
23.7
26.9
16.1
14.2
3.8
3.2
23.5
22.8
2.8
2.5
HT Media
Neutral
97
-
2,261
2,589
2,830
15.1
15.4
8.3
10.9
11.7
8.9
1.0
0.9
8.4
10.4
0.4
0.3
Jagran Prakashan
Buy
176
225
5,762
2,541
2,835
28.5
28.7
12.7
14.1
13.9
12.5
2.9
2.5
21.3
21.4
2.1
1.8
Sun TV Network
Neutral
816
-
32,167
3,238
3,789
51.9
55.1
30.9
38.0
26.4
21.5
7.5
6.6
30.0
31.0
9.4
8.0
Hindustan Media
Neutral
246
-
1,806
1,002
1,074
23.3
23.5
29.2
33.8
8.4
7.3
1.3
1.1
15.6
15.4
0.8
0.5
Ventures
TV Today Network
Accumulate
389
435
2,323
667
727
27.7
27.7
18.6
20.1
20.9
19.4
3.3
3.3
15.6
17.3
3.0
2.8
Music Broadcast Limited Accumulate
405
434
2,309
271
317
91.0
109.0
6.0
10.0
67.5
40.5
4.2
3.8
6.5
9.3
8.1
6.7
Metals & Mining
Coal India
Neutral
286
-
177,222
82,301
91,235
17.0
18.0
17.1
20.5
16.7
13.9
3.1
2.9
45.0
55.0
1.8
1.6
Hind. Zinc
Neutral
314
-
132,717
22,108
24,555
57.0
58.0
22.1
26.3
14.2
11.9
4.6
3.7
32.0
35.0
5.0
4.2
Hindalco
Neutral
252
-
56,449
102,350
105,355
13.5
14.5
21.5
24.5
11.7
10.3
1.6
1.4
15.0
15.2
1.1
1.1
JSW Steel
Neutral
260
-
62,799
64,500
68,245
21.1
21.5
20.1
21.2
12.9
12.3
2.4
2.0
-
-
1.7
1.6
NMDC
Neutral
121
-
38,188
10,209
11,450
47.0
48.0
11.1
12.1
10.9
10.0
1.5
1.4
-
-
3.3
2.9
SAIL
Neutral
57
-
23,521
54,100
63,555
3.0
10.0
(10.0)
1.5
38.0
0.8
0.8
-
-
1.4
1.2
Vedanta
Neutral
321
-
119,322
81,206
87,345
28.0
29.0
26.5
33.5
12.1
9.6
2.8
2.4
-
-
2.2
1.9
Tata Steel
Neutral
691
-
67,077
121,445
126,500
16.2
17.2
65.4
81.3
10.6
8.5
1.7
1.4
-
-
1.1
0.9
Oil & Gas
GAIL
Neutral
444
-
75,162
53,115
52,344
14.2
15.3
30.0
31.1
14.8
14.3
1.9
1.7
-
-
1.1
1.1
ONGC
Neutral
170
-
218,422
83,111
84,934
44.2
44.9
16.4
16.9
10.4
10.1
1.3
1.2
-
-
2.5
2.5
Indian Oil Corp
Neutral
411
-
199,505
396,116
432,560
8.5
8.8
40.1
42.2
10.3
9.7
1.8
1.6
-
-
0.6
0.6
Reliance Industries
Neutral
843
-
548,531
257,711
267,438
17.0
18.2
89.1
89.5
9.5
9.4
0.9
0.8
-
-
1.8
1.7
Pharmaceuticals
Alembic Pharma
Buy
500
600
9,429
3,903
4,584
18.2
19.2
21.8
27.2
22.9
18.4
4.2
3.5
19.8
20.6
2.4
2.1
Alkem Laboratories Ltd
Accumulate
1,849
2,079
22,105
6,320
7,341
17.5
19.8
72.7
96.6
25.4
19.1
4.5
3.8
16.7
18.7
3.4
2.9
Aurobindo Pharma
Accumulate
735
823
43,068
17,086
19,478
22.1
22.0
44.7
51.4
16.5
14.3
3.6
2.9
24.7
22.7
2.6
2.3
Aventis*
Neutral
4,057
-
9,344
2,508
2,862
16.8
16.8
139.9
153.8
29.0
26.4
4.2
3.4
23.5
25.8
3.3
2.7
Cadila Healthcare
Reduce
494
426
50,522
11,584
13,228
20.3
20.4
18.7
21.3
26.4
23.2
5.9
4.8
24.6
22.9
4.2
3.6
Cipla
Sell
589
458
47,420
16,619
19,437
15.4
16.2
19.7
24.3
29.9
24.3
3.4
3.0
12.0
13.2
3.0
2.6
Dr Reddy's
Neutral
2,410
-
39,960
15,844
17,973
17.6
18.2
91.7
111.0
26.3
21.7
3.0
2.7
11.9
13.0
2.7
2.4
GSK Pharma*
Neutral
2,411
-
20,423
3,260
3,651
15.0
18.0
46.1
58.6
52.3
41.2
10.7
11.1
20.0
26.5
6.2
5.6
Indoco Remedies
Sell
241
153
2,224
1,154
1,310
14.9
14.9
11.3
12.7
21.4
19.0
3.0
2.7
15.0
15.0
2.1
1.8
Stock Watch
October 11, 2017
Company Name
Reco
CMP
Target
Mkt Cap
Sales ( Čcr )
OPM(%)
EPS (Č)
PER(x)
P/BV(x)
RoE(%)
EV/Sales(x)
(Č)
Price ( Č)
( Č cr )
FY18E FY19E
FY18E
FY19E
FY18E
FY19E
FY18E
FY19E
FY18E
FY19E
FY18E
FY19E
FY18E
FY19E
Pharmaceuticals
Ipca labs
Neutral
519
-
6,547
3,593
4,022
14.5
15.5
19.4
25.2
26.8
20.6
2.4
2.2
9.5
11.2
1.9
1.7
Lupin
Buy
1,061
1,467
47,918
18,657
21,289
21.3
23.3
52.8
66.7
20.1
15.9
3.0
2.6
16.3
17.5
2.6
2.1
Natco Pharma
Accumulate
991
1,057
17,276
1,886
2,016
32.3
29.5
23.2
22.0
42.8
45.0
9.0
7.9
20.9
17.6
9.0
8.4
Sun Pharma
Accumulate
527
558
126,512
32,899
36,451
26.9
25.4
31.6
32.3
16.7
16.3
2.9
2.6
18.7
18.8
3.5
3.0
Syngene International
Accumulate
494
557
9,885
1,402
1,823
32.8
36.0
15.9
20.7
31.1
23.9
5.8
4.8
18.7
20.0
7.0
5.4
Power
Tata Power
Neutral
82
-
22,057
32,547
33,806
20.5
20.5
4.7
5.4
17.4
15.2
1.7
1.4
10.5
10.5
1.7
1.6
NTPC
Neutral
175
-
144,419
86,070
101,246
28.3
30.7
12.9
16.2
13.6
10.8
1.4
1.3
10.6
12.4
3.0
2.7
Power Grid
Accumulate
205
223
107,038
29,183
32,946
89.7
90.0
18.0
20.8
11.4
9.8
1.9
1.7
17.7
18.2
7.6
7.1
Real Estate
Prestige Estate
Neutral
299
-
11,198
4,607
5,146
21.0
22.2
7.9
9.8
37.8
30.5
2.3
2.2
10.3
12.0
3.6
3.3
MLIFE
Accumulate
468
522
2,404
487
590
12.3
17.8
21.0
31.2
22.3
15.0
1.2
1.1
5.2
7.4
3.7
3.0
Telecom
Bharti Airtel
Neutral
384
-
153,520
97,903
105,233
36.0
36.3
9.3
11.1
41.3
34.8
2.0
1.9
5.0
5.6
2.5
2.3
Idea Cellular
Neutral
73
-
26,312
35,012
37,689
27.1
27.7
(4.4)
(2.7)
1.1
1.2
(6.8)
(4.6)
2.1
1.8
zOthers
Abbott India
Neutral
4,142
-
8,802
3,244
3,723
14.9
16.1
167.5
209.4
24.7
19.8
5.5
4.6
23.7
24.8
2.4
2.0
Asian Granito
Accumulate
496
570
1,492
1,169
1,286
12.5
12.5
16.0
19.7
31.0
25.2
3.3
2.9
10.7
11.6
1.5
1.3
Bajaj Electricals
Neutral
388
-
3,944
4,646
5,301
6.7
7.6
16.1
22.3
24.1
17.4
3.9
3.4
16.4
19.2
0.8
0.7
Banco Products (India)
Neutral
216
-
1,546
1,530
1,695
13.2
12.7
19.0
20.0
11.4
10.8
1.8
1.6
0.2
0.2
0.9
102.2
Coffee Day Enterprises
Neutral
216
-
4,441
3,494
3,913
17.4
18.0
4.8
5.7
-
37.8
1.9
1.8
-
0.1
1.7
1.5
Ltd
Elecon Engineering
Neutral
68
-
757
171
201
15.0
16.2
36.0
43.0
1.9
1.6
0.2
0.2
0.1
0.1
3.8
3.2
Garware Wall Ropes
Neutral
929
-
2,033
928
1,003
15.2
15.2
39.4
43.2
23.6
21.5
3.9
3.3
16.5
15.4
2.1
1.8
Goodyear India*
Neutral
827
-
1,908
1,717
1,866
11.8
12.3
47.9
49.8
17.3
16.6
2.7
2.3
15.6
15.7
0.8
115.5
Hitachi
Neutral
2,056
-
5,590
2,355
2,715
10.3
10.8
49.0
60.9
42.0
33.8
9.8
7.8
0.2
0.2
2.4
2.1
HSIL
Neutral
454
-
3,283
2,240
2,670
14.6
15.0
17.0
22.0
26.7
20.6
2.2
2.1
0.1
0.1
1.7
1.4
Interglobe Aviation
Neutral
1,117
-
40,393
22,570
27,955
14.2
15.0
63.6
81.8
17.6
13.7
9.2
7.8
0.5
0.6
1.5
1.1
Jyothy Laboratories
Neutral
394
-
7,150
1,781
2,044
14.1
15.0
9.4
10.5
42.1
37.5
9.0
8.4
0.2
0.2
4.2
3.6
Linc Pen & Plastics
Neutral
245
-
362
420
462
9.3
9.3
15.3
17.1
16.0
14.3
2.7
2.8
16.9
19.5
0.9
0.8
M M Forgings
Neutral
784
-
946
542
642
20.1
21.0
41.6
56.8
18.9
13.8
2.6
2.2
0.1
0.2
2.2
1.9
Mirza International
Neutral
162
-
1,948
1,148
1,285
18.0
18.0
8.0
9.4
20.1
17.3
3.3
2.8
16.3
16.1
1.9
1.6
Navkar Corporation
Buy
187
265
2,667
561
617
41.5
41.5
11.5
12.7
16.2
14.7
1.7
1.5
10.5
10.4
5.4
4.7
Nilkamal
Neutral
1,610
-
2,402
2,317
2,525
11.4
11.1
96.0
105.0
16.8
15.3
2.8
2.5
0.2
0.2
1.0
0.9
Stock Watch
October 11, 2017
Company Name
Reco
CMP
Target Mkt Cap
Sales ( Čcr )
OPM(%)
EPS (Č)
PER(x)
P/BV(x)
RoE(%)
EV/Sales(x)
(Č)
Price ( Č)
( Č cr )
FY18E FY19E FY18E FY19E FY18E FY19E FY18E FY19E FY18E FY19E FY18E FY19E FY18E FY19E
zOthers
Parag Milk Foods
Neutral
254
-
2,133
1,987
2,379
7.6
9.0
12.4
18.3
20.5
13.9
2.9
2.5
8.2
13.2
1.2
1.0
Radico Khaitan
Neutral
174
-
2,313
1,811
1,992
13.2
13.2
8.1
8.8
21.4
19.7
2.2
2.4
10.1
12.0
1.6
1.5
Relaxo Footwears
Neutral
520
-
6,241
1,981
2,310
13.7
14.5
12.0
15.5
43.3
33.5
8.4
6.8
0.2
0.2
3.2
2.8
Siyaram Silk Mills
Accumulate
2,655
2,856
2,489
1,769
1,981
12.7
12.7
113.1
131.1
23.5
20.3
3.6
3.1
15.5
15.5
1.6
1.4
Styrolution ABS India* Neutral
1,030
-
1,810
1,800
1,980
8.0
8.1
42.0
46.2
24.5
22.3
2.8
2.4
0.1
0.1
1.1
1.0
Surya Roshni
Neutral
310
-
1,358
4,870
5,320
7.7
7.8
22.8
28.1
13.6
11.0
1.8
1.6
0.1
0.1
0.5
0.4
TVS Srichakra
Neutral
3,046
-
2,332
2,729
2,893
12.7
12.5
248.5
265.0
12.3
11.5
3.5
2.8
0.3
0.3
0.9
0.8
Visaka Industries
Neutral
693
-
1,101
1,104
1,214
12.1
12.6
31.0
37.9
22.4
18.3
2.7
2.4
0.1
0.1
1.2
1.1
VIP Industries
Accumulate
273
300
3,852
1,450
1,693
10.4
10.5
6.5
7.8
41.7
34.9
8.8
7.7
21.1
22.1
2.6
2.3
Navin Fluorine
Neutral
740
-
3,650
945
1,154
22.4
22.6
28.7
34.8
25.8
21.3
4.3
3.7
-
-
3.4
2.7
Source: Company, Angel Research; Note: *December year end; #September year end; &October year end; Price as on October 10, 2017
Market Outlook
October 11, 2017
Research Team Tel: 022 - 39357800
DISCLAIMER
Angel Broking Private Limited (hereinafter referred to as “Angel”) is a registered Member of National Stock Exchange of India
Limited,Bombay Stock Exchange Limited and Metropolitan Stock Exchange Limited. It is also registered as a Depository Participant with
CDSL and Portfolio Manager with SEBI. It also has registration with AMFI as a Mutual Fund Distributor. Angel Broking Private Limited is a
registered entity with SEBI for Research Analyst in terms of SEBI (Research Analyst) Regulations, 2014 vide registration number
INH000000164. Angel or its associates has not been debarred/ suspended by SEBI or any other regulatory authority for accessing
/dealing in securities Market. Angel or its associates/analyst has not received any compensation / managed or
co-managed public offering of securities of the company covered by Analyst during the past twelve months.
This document is solely for the personal information of the recipient, and must not be singularly used as the basis of any investment
decision. Nothing in this document should be construed as investment or financial advice. Each recipient of this document should make
such investigations as they deem necessary to arrive at an independent evaluation of an investment in the securities of the companies
referred to in this document (including the merits and risks involved), and should consult their own advisors to determine the merits and
risks of such an investment.
Reports based on technical and derivative analysis center on studying charts of a stock's price movement, outstanding positions and
trading volume, as opposed to focusing on a company's fundamentals and, as such, may not match with a report on a company's
fundamentals. Investors are advised to refer the Fundamental and Technical Research Reports available on our website to evaluate the
contrary view, if any.
The information in this document has been printed on the basis of publicly available information, internal data and other reliable
sources believed to be true, but we do not represent that it is accurate or complete and it should not be relied on as such, as this
document is for general guidance only. Angel Broking Pvt. Limited or any of its affiliates/ group companies shall not be in any way
responsible for any loss or damage that may arise to any person from any inadvertent error in the information contained in this report.
Angel Broking Pvt. Limited has not independently verified all the information contained within this document. Accordingly, we cannot
testify, nor make any representation or warranty, express or implied, to the accuracy, contents or data contained within this document.
While Angel Broking Pvt. Limited endeavors to update on a reasonable basis the information discussed in this material, there may be
regulatory, compliance, or other reasons that prevent us from doing so.
This document is being supplied to you solely for your information, and its contents, information or data may not be reproduced,
redistributed or passed on, directly or indirectly.
Neither Angel Broking Pvt. Limited, nor its directors, employees or affiliates shall be liable for any loss or damage that may arise from
or in connection with the use of this information.